Feature Request: Explain Why Indexes Were Skipped
Inciting incident
I recently read about a really interesting feature of RavenDB on Oren’s blog:
RavenDB 4.1 Features - Explain that choice
You should check out the post - and RavenDB, it’s pretty nifty as well!
The gist of the feature is that, during the query optimization process, the database engine exposes information about each of the indexes it considered using - information including the reason why the index was rejected!
Index choices in SQL Server
There are countless examples online of folks coming to a forum or Q&A site and asking “why isn’t SQL Server using my beautifully crafted index?” An extremely brief Google search for sql server why index is not used led me to these posts (among many others):
- How Does SQL Server Choose Indexes to Use
- Why isn’t SQL Server using my index?
- Why is query NOT using my index?
- Sql Server - Index not being used
- SQL Server why is index not used with OR
- SQL Server why index is not used
- SQL Server 2008R2 - Why is my index not used
- clustered index not being used
As you can see from the answers to these questions, there are many factors at play when the optimizer chooses to use or not use an index (how narrow or wide is the index, is it covering, how many rows were estimated to be returned, etc).
Understanding these various situations requires specialized knowledge and lots of experience with tuning queries and seeing how the optimizer reacts.
The future

From: https://commons.wikimedia.org/wiki/File:Back_left.JPG
I think there’s a clear desire in the SQL Server community to know why the optimizer chooses to use, or not use, indexes on a table. However we can get that information, whether it’s in actual execution plans, or a fully fleshed out Extended Event target.
To that end, I’ve created the following UserVoice request:
Explain why indexes were skipped
Here’s a screenshot of a possible implementation:
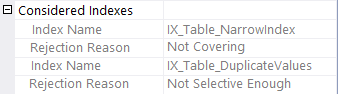
Please go vote and comment if you’d like to see this in the product!
Miscellaneous
I went down a couple of dead ends while researching this post. Here are some things that don’t solve this problem.
Extended events
I came across an extended event called unmatched_filtered_indexes with this description:
Occurs when the optimizer cannot use a filtered index due to parameterization.
This is actually the exact kind of thing that RavenDB is providing - it’s just an extremely narrow scenario. It only applies to filtered indexes, and it only fires when the index was rejected because of parameterization:
The query optimizer won’t consider filtered indexes if you’re using local variables or parameterized SQL for the predicate that matches the filter.
Trace flag 302
I’ve seen several references to “Trace Flag 302” with descriptions like this:
Prints information about whether the statistics page is used, the actual selectivity (if available), and what SQL Server estimated the physical and logical I/O would be for the indexes. Trace flag 302 should be used with trace flag 310 to show the actual join ordering.
Most of the references are to SQL Server 6.5 and 2000. This TF doesn’t appear to do anything when I run it on newer versions of SQL Server, but some of the posts online indicate that it used to dole out information about considered indexes. I’d be really interested if anyone has experience with this TF from “back in the day” =)
Thanks for reading!